Grafana, Influxdb, Docker: Pie chart dashboard creation tutorial

This tutorial shows how to:
- setup and configure an environment with a Grafana server and an InfluxDB server, using docker-compose,
- configure a datasource in order to display InfluxDB database data on Grafana dashboards,
- insert data into InfluxDB via API and interactive shell,
- install and configure Grafana Piechart plugin,
- create and configure a Grafana dashboard.
Introduction
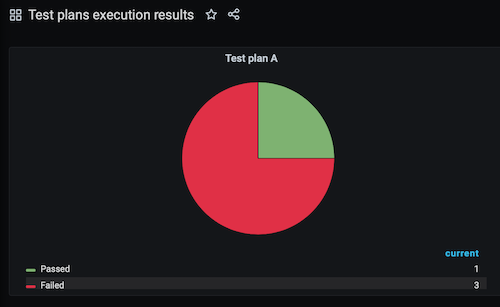
The dashboard we are going to build will show the latest status of the test plan execution. Test plan execution results are accumulated in an InfluxDB database.
Both, Grafana and InfluxDB are popular opensource tools. They are relatively simple to install, setup and use. And they definitively provide a means to create a nice-looking, reliable working solution in a short period of time at any platform (basically, we need only docker and docker-compose pre-installed on the target machine).
The resulting Grafana Pie chart dashboard will look like this:
Create docker-compose.yml to install Grafana and InfluxDB
The easiest way to install Grafana and InfluxDB is to use the corresponding Docker images. We will use docker-compose to pull images, create containers, volumes, a network, and expose ports.
Clone the ygrebnov/grafana-influxdb repository containing a docker-compose.yml file:
git clone [email protected]:ygrebnov/grafana-influxdb.git
Alternatively, you can create a docker-compose.yml file manually by copying the content of the file from the ygrebnov/grafana-influxdb repository:
- create a directory to store your project files,
- navigate to the project directory,
- create a
docker-compose.ymlfile - using your favorite text editor, place the content from the
ygrebnov/grafana-influxdbrepository to thedocker-compose.ymlfile
mkdir grafana-influxdb
cd grafana-influxdb
touch docker-compose.yml
As you can see from the docker-compose.yml file, we are creating two containers: grafana and influxdb. Two volumes are created: grafana-volume and influxdb-volume. The containers belong to the dashboard-network. Two ports are exposed: 3000 – to access Grafana web-based GUI and 8086 – to access InfluxDB server.
Please note that we are using the lightweight alpine images of both, Grafana and InfluxDB. This makes it easier to integrate the creation of the grafana-influx containers into a bigger script of dynamic environment creation and setup.
Create network and volumes
Create a dashboard-network and two volumes: grafana-volume and influxdb-volume:
docker network create dashboard-network
docker volume create grafana-volume
docker volume create influxdb-volume
Configure InfluxDB
InfluxDB container comes with a handy init-influxdb.sh script used to perform the initial InfluxDB configuration: creation of a database and some users. We will create a dashboard database, an admin user, and a user with read/write privileges:
docker run --rm -e INFLUXDB_DB=dashboard \
-e INFLUXDB_ADMIN_USER=admin \
-e INFLUXDB_ADMIN_PASSWORD=admin \
-e INFLUXDB_USER=user \
-e INFLUXDB_USER_PASSWORD=user \
-v influxdb-volume:/var/lib/influxdb influxdb:alpine /init-influxdb.sh
This pulls the influxdb:alpine image, builds a container with volume influxdb-volume, and executes the initialization script. After the script execution, the container is automatically destroyed. Database and users data is passed as the environment variables values.
You will see the initialization script output printed out to the console.
Create Grafana and InfluxDB containers
With the docker-compose.yml file in place, we can create Grafana and InfluxDB containers by executing:
docker-compose up -d
We do not have to specify the file name, as docker-compose looks for a file named docker-compose.yml in the current directory.
From the console output we can see that a grafana image is pulled (there is no need to pull influxdb image, as we have already done it during the InfluxDB setup). Finally, two containers are created: grafana and influxdb.
Verify that the grafana and influxdb containers are up:
$ docker ps
CONTAINER ID        IMAGE                    COMMAND                  CREATED             STATUS              PORTS                    NAMES
1beb9e358b3f        influxdb:alpine          "/entrypoint.sh infl…"   6 minutes ago       Up 6 minutes        0.0.0.0:8086->8086/tcp   influxdb
3f26f11304c8        grafana/grafana:latest   "/run.sh"                6 minutes ago       Up 6 minutes        0.0.0.0:3000->3000/tcp   grafana
Install Grafana Piechart plugin
Grafana container comes with grafana-cli. We will use it to install the Grafana Piechart plugin.
Open an interactive shell in the grafana container:
docker exec -it grafana bash
Install the Grafana Piechart plugin:
grafana-cli plugins install grafana-piechart-panel
The installation script output finishes with a request to restart the Grafana-server service. Since we cannot restart the grafana-server service in a docker container directly, we will restart the whole container, which will, among other things, restart the grafana-server service.
Return to the host machine:
exit
Restart grafana container:
docker restart grafana
Add data to InfluxDB database
I will show you two ways of how to add data to an InfluxDB database: using InfluxDB API and via the InfluxDB interactive shell.
Add data to InfluxDB database via InfluxDB API
Adding data via InfluxDB API is my preferred way. I frequently use it in scripts where I parse and aggregate data and then send the results to InfluxDB database.
Using curl, we send a POST request to the /write endpoint, specifying the InfluxDB server IP address and port and the name of the database. Data is sent using the following syntax: measurement,tag=value field=value.
Measurement is a RDBMS table equivalent. Tags always have string values, fields can have values of different types, allowing you to perform mathematical operations with them.
There can be multiple tags and multiple fields. A single space is allowed only in one place – between the group of tags and the group of fields.
Insert a line into the dashboard database. The test plan id will be the measurement value (test_plan_a). We will use test case id as the tag (test_case_id=tc1), result field will contain the test case execution result. Passed tests cases will have result=1, failed – result=0.
An example of inserting data into InfluxDB database via the InfluxDB API:
curl -i -XPOST 'http://localhost:8086/write?db=dashboard' \
--data-binary 'test_plan_a,test_case_id=tc1 result=1'
In case there is no error, InfluxDB server responds with 204 code:
HTTP/1.1 204 No Content
Content-Type: application/json
Request-Id: 358918a8-a054-11ea-8001-0242ac120002
X-Influxdb-Build: OSS
X-Influxdb-Version: 1.8.0
X-Request-Id: 358918a8-a054-11ea-8001-0242ac120002
Date: Wed, 27 May 2020 19:56:52 GMT
Add data to InfluxDB database via the InfluxDB interactive shell
Adding data to InfluxDB database via the interactive shell is a good way to explore the database from the inside and to better understand how it is organized.
Start the InfluxDB interactive shell in the influxdb container:
docker exec -it influxdb influx
You should see the InfluxDB interactive shell prompt:
Connected to http://localhost:8086 version 1.8.0
InfluxDB shell version: 1.8.0
>
Set database for the requests:
USE dashboard
Let’s first check if the line we have inserted using curl is present in the database:
SELECT * FROM test_plan_a
As we can see from the output, the line is present, as expected:
name: test_plan_a
time                result test_case_id
----                ------ ------------
1590609412410067200 1      tc1
As you have definitely noticed, test_plan_a measurement data contains a field with the name time which we have not inserted. InfluxDB is a time series database. By the nature of the database, its data always has a timestamp as an attribute. So if the timestamp is not provided during the data insert, the field time (with the corresponding value) is added automatically.
Via the InfluxDB interactive shell the data is added using an INSERT statement. Its syntax is similar to the one used in curl: INSERT measurement,tag=value field=value.
An example of inserting data into InfluxDB database via the InfluxDB interactive shell:
INSERT test_plan_a,test_case_id=tc2 result=0
Verify data:
SELECT * FROM test_plan_a
Two lines are returned, as expected. We can exit from the influxdb container and return to the host machine:
exit
Configure Grafana
Grafana web UI can be accessed using the port we have specified in the grafana container configuration. The port 3000 is used by default.
Open http://localhost:3000 in your favorite browser.
Use the default initial admin user credentials: username: admin, password: admin. On the first login, Grafana proposes you to modify the default password. You can skip this step, if you want.
Add InfluxDB datasource to Grafana
At the Grafana Welcome page, click on the Add your first data source panel.
Select InfluxDB.
In the HTTP section, enter http://influxdb:8086 to the URL field. This is a bit tricky, as we use the influxdb container name in the URL.
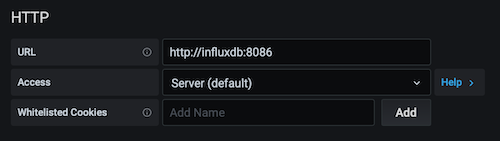
In the InfluxDB details section, enter the database name, the username and the password of the user with read and write privileges.
Click at Save & Test button at the bottom of the page. If you have done everything correctly, a green Data source is working message is displayed.
Click at the Grafana icon at the page top left corner to return to the Grafana Welcome page. Note that as we have added a data source, the Add your first data source panel is marked as completed.
Create a Pie Chart dashboard in Grafana
At the Grafana Welcome page, click on the Create your first dashboard panel.
Click at Add new panel button.
In the panel settings on the right side of the page, select Visualization -> Pie Chart.
Configure Grafana panel query for a Pie Chart
A pie chart cannot display time series data, it is against its nature. What it can do well is to display data showing fractions of some entity. We will create a query fetching and modifying data in a way so that it can be displayed at a pie chart.
The pie chart in our example will show the grouped results of the test_plan_a execution: passed test cases and failed test cases. For the sake of simplicity, let’s assume that each test case has already been executed at least once.
We will use a complex query with a subquery. We will select the latest result value for each test case and reuse this select result for the subsequent data manipulations. As result=1 for the passed test cases, our total number of passed test cases is equal to the sum of the result field values. The total number of the failed test cases is equal to the difference between the number of test cases and the number of passed test cases. We will give aliases to our resulting values in order to display them in a nice way.
We will configure the Grafana Pie chart panel query in the text edit mode. Click on the pencil icon in order to enable it.
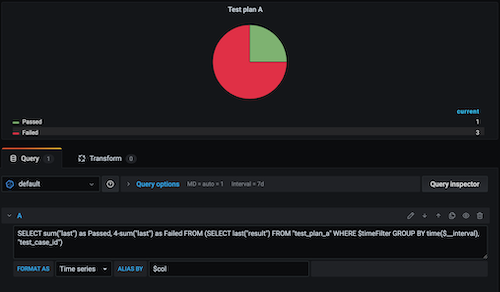
An InfluxDB query example for the Grafana Pie chart:
SELECT sum("last") as Passed, 4-sum("last") as Failed FROM (SELECT last("result") FROM "test_plan_a" WHERE $timeFilter GROUP BY time($__interval), "test_case_id")
Now we will add a few details to make the Pie chart look better. First of all, we will remove the measurement name prefixing each category on the legend. Adding $col to the Alias by field achieves that. Now we have only the aliases (Passed and Failed) displayed on the legend.
Secondly, we will change the Pie chart Passed value color from yellow to red. It can be done by clicking on the corresponding line in the legend. Select the red color from the color picker widget.
And finally, we will give the Pie chart a name. A name is entered into the Panel title field on the right side of the Setting panel.
Click on the Save button and then on the Apply button. The Pie chart is ready. Mission accomplished.
Please feel free to send me your comments and/or questions by mail: [email protected].